
Those who know us or have had the opportunity to work with us, know that one of our main objectives is to guarantee publishers and authors a simple, intuitive, clear publishing and distribution experience. The effects of the past few months on the entire publishing sector have given our historical mission new life. We announced a year full of news and here we are today to shout out that we have finally launched the new Dashboard, which comes with more detailed and customizable Analytics!
A few days ago we enabled all of our clients to try a preview of the new user interface. We are aware that for some, getting used to those changes might be irksome; for this reason, we have decided to have a gradual transition from the previous workspace, giving all users the possibility to switch with a click from the old to the new Dashboard. The switch will only be available for a limited time, so our advice is to start getting familiar with the new settings. Are you curious to discover its new features? Good, let's start!
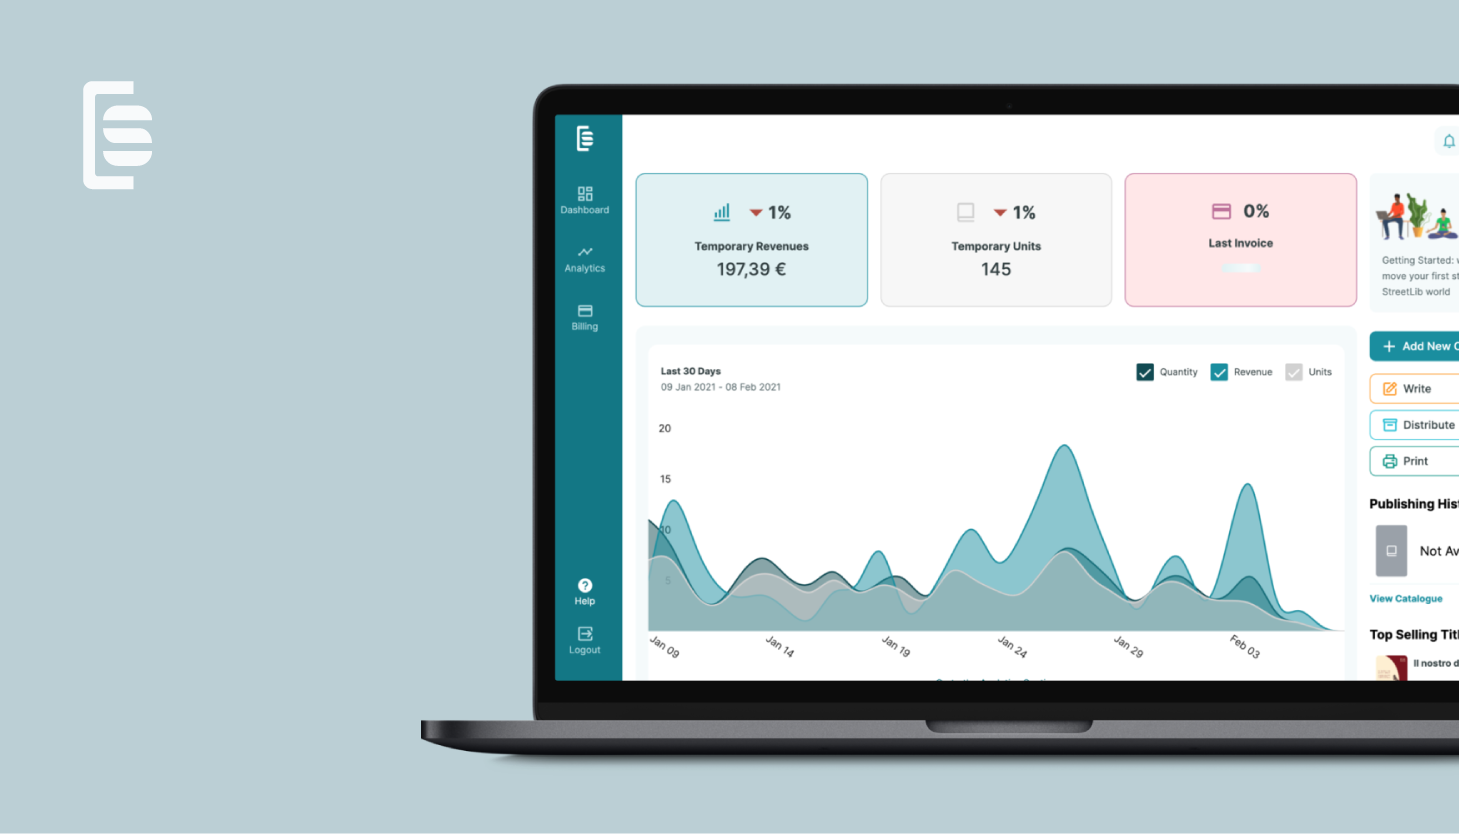
A more user-friendly Homepage
Those who are already using our Mobile App will surely notice some similarities. The layout of the new Home duplicates the colors and the graphic settings of the application, which are now more dynamic and user-friendly. Once you access the platform, you'll find an overview of temporary sales trends (in other words, the sales data that are reported daily and updated by the various stores) for the last thirty days. Reading the data is simple and intuitive. The most relevant information (general revenues divided by formats, units sold, billing) is grouped into charts and boxes. To keep track of sales and distribution trends over time, we've added the ability to compare data with customized previous periods.
The importance of being up to date and informed
One of the most interesting innovations is the menu on the right side, vertical and visible. The sections introduced are entirely dedicated to the management of the catalog. With one click, you can add new content and directly access our applications (StreetLib Write, StreetLib Publish, and StreetLib Print). To follow, we've included a short history, which is useful to keep track of the most recent publications and the latest changes made to various articles. For each title, the available formats are specified (ebook, audiobook, print on demand). Finally, just below the sales charts, we've added a section dedicated to our new blog, full of updates and insights on the publishing world and the book market.
More and more data
You can't manage what you can't measure, let alone improve. Do you agree? We're very much aware of the importance of being able to have access to as much data as possible when it comes to the sales and distribution of catalogs; for this reason, we've added an update to both the Dashboard and Analytics. The tool is easily accessible from the new menu on the left-hand side. Once you've entered the section, you'll have different charts and tables available to monitor sales, which will be divided by format, business model, stores, title, category, and so on. We know that each author and publisher have specific needs for the management of catalogs, so we’ve tried to give ample space to the customization of the analysis and data reading experience. How did we do it? For example, by including the possibility to organize the display of reports based on different categories available and by expanding our range of filters. On top of the classic parameters already in use (units, quantities, earnings), we've added several options so you can organize the data based on your needs.
Last but not least: save filter function and data comparison
Those who have been using our platform and the Analytics system for a long time will notice the introduction of new functions: now you can save your filter combinations so that you can activate them, in a combined way, whenever you need to. A simple, convenient, and fast way to customize reports. Just one click will be enough to apply the combination of filters you need, avoiding the tedious repeated setting of the many options available.
Finally, the new function "compare with" is now available for Analytics and is very useful to display, in real-time, data comparison for selected periods - all fully customizable. Compared data is rendered in percentage to provide an immediate overall view of the sales trend and more broadly, at the distribution performance.
Usability, accessibility, multi-format!
We have structured our entire update on these three concepts. The pandemic, in its extraordinary nature, may have instigated a modern-day Renaissance of the publishing industry, made up of stories that are increasingly multi-formatted, new business models, new modes of consumption, and new and effective publication flows. For our users, the new Dashboard and Analytics will be efficient and easy-to-use tools, pivotal in allowing them to seize new opportunities that appear to be looming on the horizon.
Have you already taken a look at the new Dashboard? Please let us know what you think, and feel free to write in the comments below for any further suggestions!