
We’re just getting started and already are rolling out our new Dashboard and Analytics!
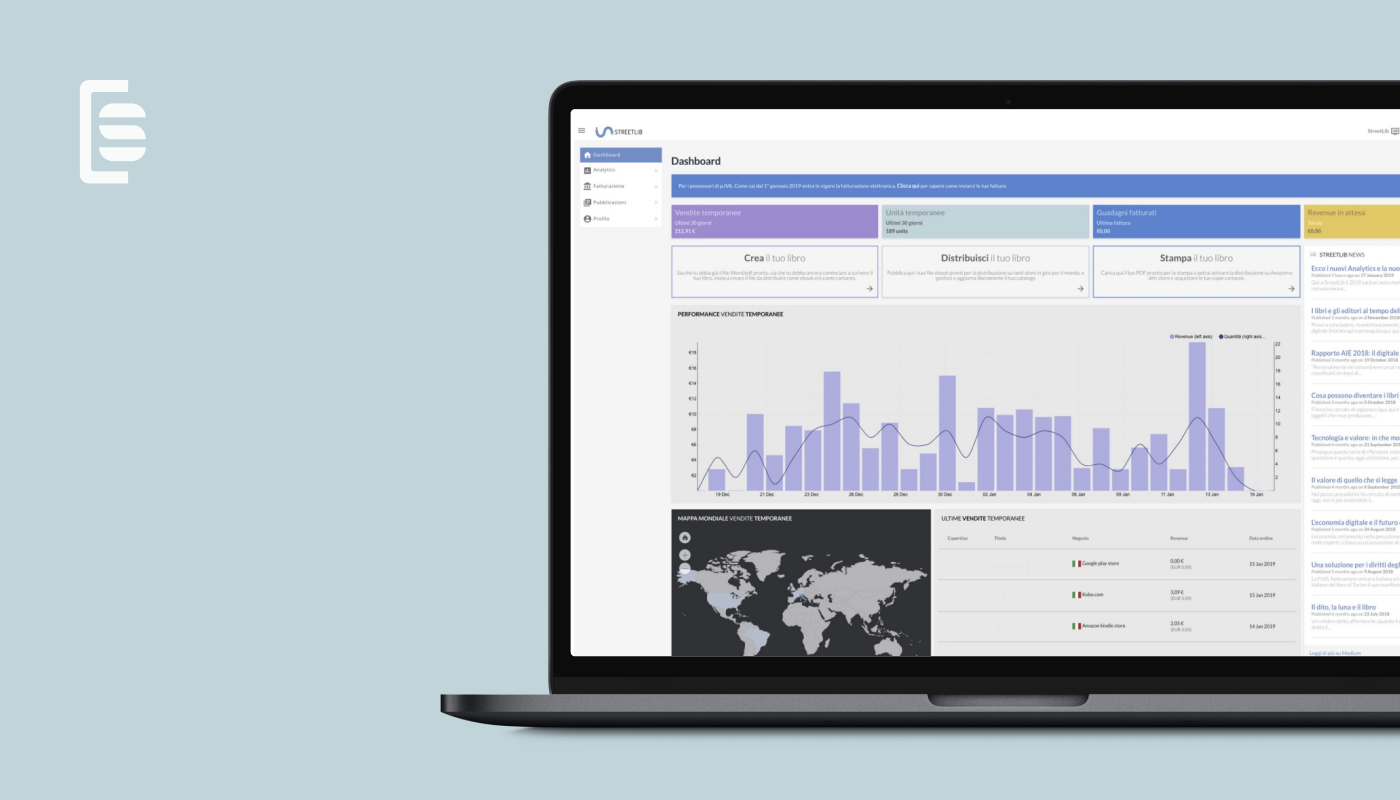
Here’s a preview of our new Dashboard:
On top is an overview of the main sales and revenue data:
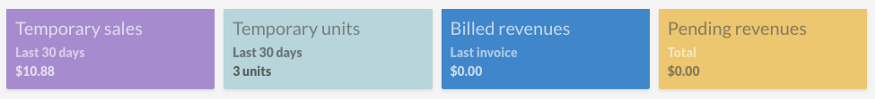
- Temporary sales data of the last 30 days: Watch out. This amount is only an estimate of your sales. We can certify only at the end of the month.
- Temporary sales units of the last 30 days: Similarly, these units are only estimates, to be validated at the end of the month.
- Billed revenues: Here you’ll see the total amount, calculated from your fiscal reports, to be paid out to you soon, according to our payment terms.
- Pending revenues: You will see this amount only if you have any invoices that have yet to be approved.
Next are the three main buttons you click on to access the apps available inside your account:
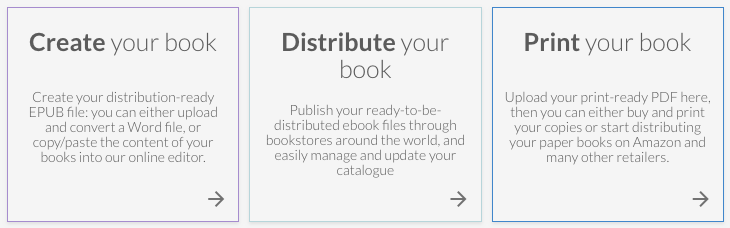
- StreetLib Write: Using Write, you can create an ebook ready to be distributed (in EPUB format). You can either upload a Word file which is automatically converted, or copy/paste the chapters of your book into the editor.
- StreetLib Publish: The “Distribute your book” button is where you can upload your book in EPUB, PDF or MOBI file format, for sale on more than 50 online bookstores around the world, such as Amazon, Apple, Google and Kobo. In the StreetLib Publish app, you can also manage and update your catalogue.
- StreetLib Print: Print is the button you use to upload your print-ready PDF and ask that the printed copies are delivered where you choose, as well as request paper distribution on Amazon or in many b&m bookstores.
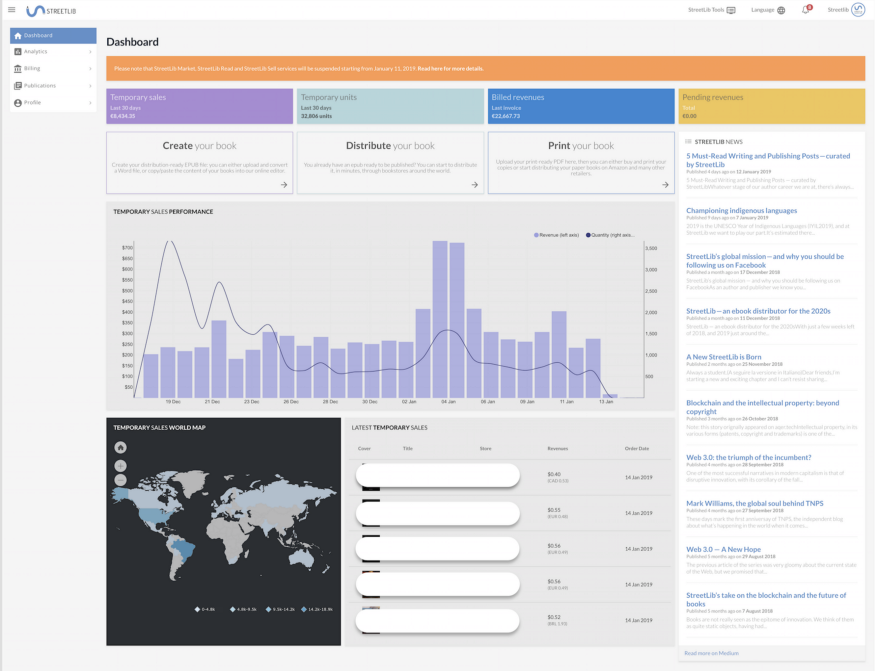
The dashboard below offers you more useful information:
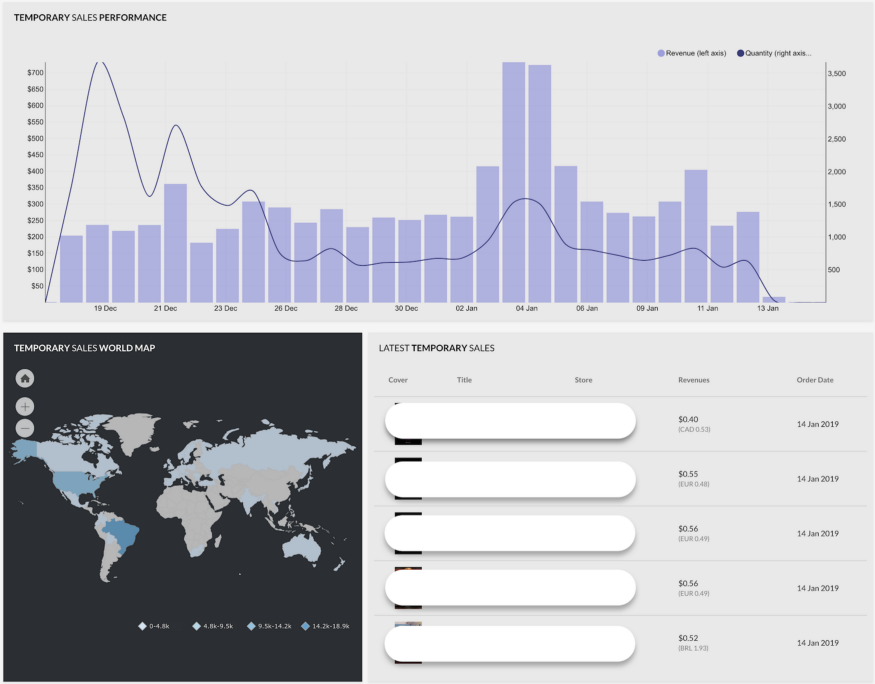
The details:
- On top is the graph where you can see the temporary sales in value and in volume (unit sold).
- The table of Latest Temporary Sales shows the book title, the price and the bookstore that sold your book.
- We also include a world map, so you can see all the countries where you sold your books.
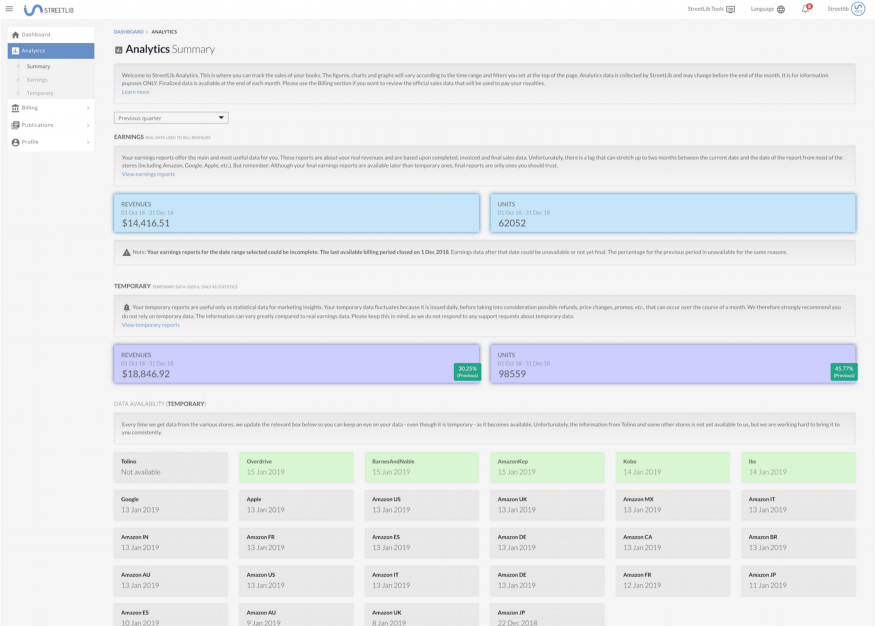
You can dig down on all details in the new Analytics!
The first thing you’ll notice in Analytics is that we’ve divided the real sales data and the temporary sales data in order to provide more transparency. Take a look:
At the top you can see your REVENUE, in light blue: This is the amount we receive from the stores’ fiscal reports:
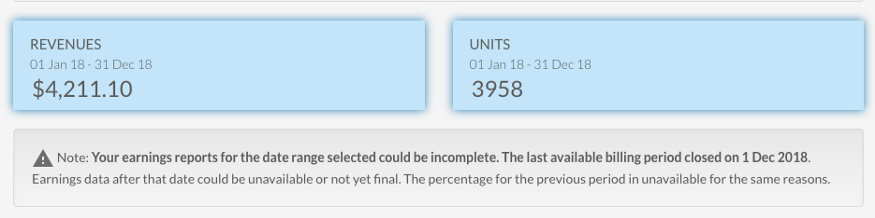
The warning message visible in the screenshot will appear only when you select a temporary slot in real sales data which not yet ready. In that case, the system will show only the real sales data available until the last fiscal report available.
In VIOLET, below, are the temporary sales data:
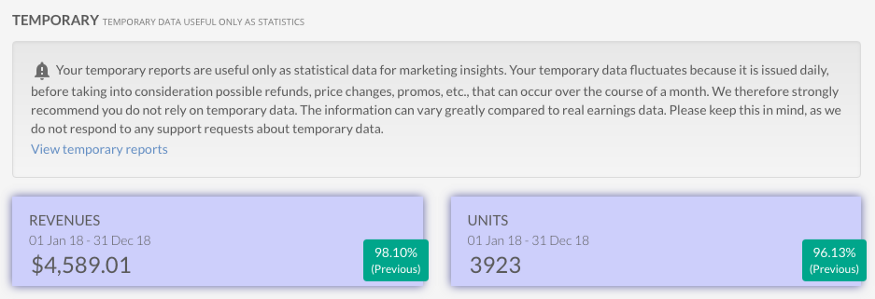
As you may know, these are the temporary sales data we get from the stores on a daily basis. They can differ from the fiscal sales data we receive at the end of the month, if there are returns or the price changes, for instance.
NB: Our invoicing and payments procedures rely on the fiscal sales data we receive at the end of the month, and not on the temporary data. That means that if you want to compare the Analytics with the money that will be paid out to you, you should compare the LIGHT BLUE data, not the VIOLET data.
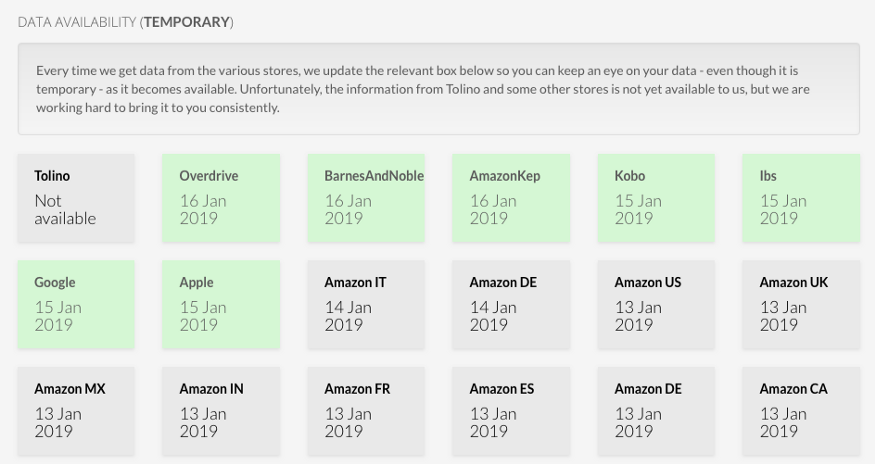
The section at the bottom of the page shows the list of the stores we received the sales data from, along with the day the data arrived. A look at this and you can easily understand how up-to-date Analytics’ temporary sales data are.
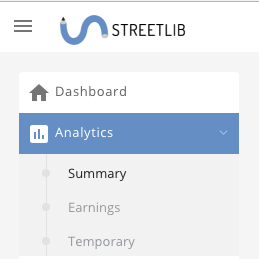
The REVENUE and TEMPORARY data can be analyzed in detail by clicking on the menu items on the left:
Our Analytics provide useful information, including a graph to help you explore your sales data. The following article offers a detailed description:
We’re doing our best to make our service more efficient, transparent and easy to use, and think these improvements reflect that.
Please feel free to share your thoughts on our improvements. Leave any comment or any suggestion in the space below.
Thank you!